WEBSITE DESIGN & DIGITAL MARKETING

Menu
Email me when new posts are made to this blog

Snowride, increases revenue by 161.5% in just 90 days (in the off season!) with the help of Zeald

Written by Sarah Gleeson on June 19th, 2013.      0 comments

www.snowride.co.nz

Online retail is a great way to target all geographic areas of your market, especially if you only have one shop down in Christchurch.  Richard Naylor, owner of Snowride, came to us looking to improve his website sales after having a few months of slow results. Considering snow gear is predominantly a seasonal buy, Richard needed to find a way to keep bringing people back to his website even in those warm summer months.  After talking with Richard, we agreed the best place to start would be to have a look at his existing website to see how it could be improved. Some of the results of this review, and the subsequent changes that we made can be seen in the image below.

What changes we made

The first noticeable difference when comparing the before and after, is the utilisation of space. We made sure to make the most of the valuable space by changing the positioning of the menu, header, and other important information such as a visible phone line. The menu was also simplified to be more customer friendly as the existing one was hard to navigate.

Situated above the fold was a large textbox, which no one read. Switching to a slideshow not only draws customers into the website, but also allows them to see offers, which acts as a conversion pathway. Introducing regular special updates is a good way to capture the customer’s attention and to keep them coming back. Not only that, but it is good for SEO.

Snowride Website Optimised Results by Zeald Snowride was aware that getting the right size was a main worry for their customers. We accommodated this by introducing a sizing chart. Additionally, the ‘Buy Back’ tab was implemented to act as another draw for the customer to return to Snowride. For parents, this is quite a favourable offer, especially for those with more than one child. By making this more visible, customers are more aware of this service.   

Our Strategy

The utilisation of both a heat and scrollmap helped us to understand customer behaviour after the website went live. The scrollmap showed us how far down the page customers were going, and whereabouts they abandoned the page. The heatmap lets us see what’s “hot” i.e. what links customers were interacting with the most. This allowed us to make any changes to the layout in order to increase conversions.  

Snowride Website Optimisation by Zeald


And the results are ...

Following from the changes on the website Snowride saw dramatic changes in the number of ski & snow gear sales..  Within the 90 days after their website went live, Snowride earned more than the entire 2012, this was a 161.5% increase. These results were particularly impressive as the 90 days were in summer and autumn months. (These results accurate at 24 May 2013.)

These results are already fantastic and we have not even hit the winter months yet!

Free Zeald Website Consultation


Set Goals and Discover Your Leads

Written by Casey Hartigan on May 14th, 2012.      1 comments

You are the only one that can tell which kind of goals are right for your business. This is why there are so many options for creating your own goals. Here are a few goals that you can setup right away that we think will be useful to a lot of businesses.

If one of the objectives of your website is to generate leads or enquiries then chances are you have one or more forms on your site that your customers are asked to fill out. We find that while these forms are useful they don't offer a true indication of how well your site is functioning as a lead generation tool. Often people can't be bothered filling out long forms, or they don't provide enough information and you can't reach a potential customer - subsequently your website records low enquiry numbers.

What your website doesn't record is the number of people who click straight onto the "Contact Us' page and give you a call or an email directly. Previously you had no way to know how many people were contacting you after seeing your website. By setting up a 'specific page was loaded' goal you can get a great idea how many people are going to your contact us page. If they visit this page chances are they're looking for your phone or email, so the number of visitors will give you a great idea how well your site is generating leads.

Tips to measure "contact us" page loads...

Get more Leads with Free Zeald Website Consultation or Audit
Topics: Measure
 

Homepage with image slideshow obtains 44% more revenue in split test

Written by Hamish Braddick on July 24th, 2011.      0 comments

As the follow on from our previous Homepage radical redesign test we really wanted to see if an animation on the homepage would help to capture visitors attention and draw them into the website, or perhaps the additional load times would serve to put people off and the animation might distract users.

Original page

Following our 11 checks for Landing page optimisation we outlined a list of points for improving the page:
Bolt of Cloth Web Design and Optimisation by Zeald

New page

Bolt of Cloth Web Site Design and Optimisation by Zeald

The results

animation-results
This test was run using the Zeald experiments software and shows reduced information for privacy reasons

What did we learn?

  • In this case animation does help to improve conversion

What next?

I would like to see if different uses of the animation can help to improve conversion. For example,
  1. what if the animation was used to support the USP,
  2. what if it showed the actual products, not in context,
  3. what if the video was used to promote incentive such as free shipping, guarantee etc 
 

Animation Support with Zeald We want to help...

Please don't forget we are right here. We have a team experienced in achieving great results for NZ businesses. We can help you with Online Marketing, SEO, Results Consulting and more...Let us help you generate more sales and enquiries with your website.  Please talk to us
 

Why measure?

Written by Hamish Braddick on March 8th, 2010.      0 comments

Remember, in order to get the best results from your website it is important that you are continually improving it. The process of continual improvement involves a continuous series of cycles. Each cycle should be made up of 3 phases and take approximately 4-6 weeks. The three phases are:

Measure > Review > Tune 

  1. Measure: You should allow at least 1 month for collecting data. (1 month)
  2. Review: At the end of that period you then need to look back at the results to determine ways to improve the website further (1day)
  3. Tune: Once you have determined the priorities for improving you then need to implement these (approx 2 weeks)

Without the measurement you never really know if the changes you are making to your website are improving it or actually making it worse. So the first step to start improving your results should be measuring your website's performance as it stands.

We can recommend ideas and changes to improve your website and we have plenty of articles to help you, but every website, business, target audience, industry and niche is different. Yes the more experience you have and the more you have studied best practices the more educated your ideas for improving your website will be, but no-one really knows for certain without measuring.

Incremental changes - An iterative approach

We recommend that you make the improvements to your website in small increments for each cycle.

If you make too many changes to your website and you find out later in the cycle that you are seeing a negative impact, it is a frustrating and time consuming task to determine which of the many changes is causing the negative results. Often the only way to find the problems is to wind back your changes and begin the cycle over again. We also understand that you have limited time and resource to dedicate to the website. There is only so much you can do each cycle to improve your website.

So with this in mind it is important that you focus your efforts on those changes that are hopefully going to have the greatest impact. The changes that are going to generate the greatest number of sales or leads.

We recommend that you schedule a regular period for reviewing your website results and making improvements.

How to measure effectively

With reporting and statistics, there is often too much information and it is easy to overload. We understand you probably have little time to analyse your reports, so we have designed our reports to deliver the most important stats to help you make a quick informed decision.

But still there is an art to understanding these reports, hence the purpose of this article. What you really need is a process or step by step guide to reading and understanding reports. You need to be able to quickly and easily find the problem areas to fix or the areas that are going really well which with some further improvement will provide the greatest return on investment.

Topics: Measure
 

Test, Measure & Tune

Written by David Kelly on November 13th, 2009.      0 comments

This is the final and most important section in the whole process of establishing a successful website.  The Test, Measure & Tune phase is an ongoing process that should never end. 

Every successful website that I have witnessed is the result of consistent ongoing improvement.  You should look to make it part of your website culture.

If you want to develop a highly persuasive website then you must commit yourself to a system of consistent ongoing improvement and in order to do this successfully in your company,  then you will need to be following a ‘Test, Measure and Tune’ (TMT) process.

A website is comparable to just about any business.  If you set up a new company it is impossible (even for the most experienced professional) to establish any organisation that runs perfectly from day one.  Good businesses become great only through consistent ongoing improvements.  A website is no different.  It is impossible to get a website perfect from day one (no matter how good you are).  A fantastic website only becomes so through careful TMT!

Importance of testing

This is the final and most important phase in the whole process.  The Test, Measure & Tune phase is an ongoing process that should never end.  

Every successful website that I have witnessed is the result of consistent ongoing improvement.  You should look to make it part of your website culture.

If you want to develop a highly persuasive website then you must commit yourself to a system of consistent ongoing improvement and in order to do this successfully in your company,  then you will need to be following a ‘Test, Measure and Tune’ (TMT) process.

A website is comparable to just about any business.  If you set up a new company it is impossible (even for the most experienced professional) to establish any organisation that runs perfectly from day one.  Good businesses become great only through consistent ongoing improvements.  A website is no different.  It is impossible to get a website perfect from day one (no matter how good you are).  A fantastic website only becomes so through careful TMT

Choosing a success metric

In order to TMT your website it is imperative to have a measurable ‘success metric’ or ‘signal’;  an objective measure that you can use to know whether you’ve made something better or worse.   

The success metric that you will use depends on what area of your website you are specifically wanting to TMT.   A list of common success metrics are outlined below.
 
  • Visits
    The Visits is the number of visits that have occurred to your website (or an individual page) over a certain period of time.  Visits are often further broken down into visits from New Visitors and Returning Visitors.   Visits are one of the most common and popular success metrics used by web marketers – especially when measuring the effectiveness of a promotional campaign.   The more visits generated by the campaign the more effective it is considered to have been.    However, visits often need to be combined with the next success metric – Conversion Rate, to truly determine the overall effectiveness of the promotional campaign.  Some campaigns can generate large numbers of  visitors but very few actual results as the campaign is targeting the wrong target of people or put another way – the visits are of low quality. 
     
  • Conversion Rate (CR)
    The conversion rate is the most popular and common of all success metrics.  It is calculated by dividing the number of conversions by the number of unique visits and multiplying the result by 100.  This s a great way of measuring the persuasiveness (or effectiveness) of a single web page (usually on the conversion pathway), or even an entire website.  

    It is very important when calculating this that you understand what constitutes a ‘conversion’ – which depends on what you are currently trying measure.  If it is the conversion of the entire website then your conversion will be your macro-conversion objective.     For some websites that might be an order,  a visitor submitting an enquiry form, registering for a free tool or signing up to the company e-zine.  For others it could be the number of visitors clicking on the ‘Contact Us’ page to locate the contact details for a company.

    However, if you are doing in-depth TMT you most likely will be trying to measure the conversion at a page level (or micro-action level) – i.e. you will want to measure what percentages of your visitors respond to individual calls to action.  Your micro-action might be ‘Add Product to Cart’, ‘Click here to find out more’ and any number of other things.
     
  • Click Through Rate (CTR)
    The CTR success metric is usually associated with online advertising.  It is used to measure both the effectives of your online promotions (pay-per-click ads, banner advertisements, text ads, directory listings, email promotions and so on) and the effectiveness of any promotions placed on your site by other advertisers.  The CTR is calculated by dividing the total clicks on an item by the total visits to the page(s) that the promotion features on and multiplying the result by 100.
     
  • Page Views Per Visit
    This is often to used to test the effectiveness of your website content.   It outlines how many pages an average visitor views before leaving your website.  It is often a good measure of the effectiveness of your pre-sales content and the overall value of your website to your visitors.  The Page Views Per Visit success metric is calculated by dividing the total number of page views by the total number of visits.
     
  • Revenue Per Visitor (RPV)
    The RPV is used by e-commerce websites to measure how effective the website is at getting orders from its visitors.  The higher the RPV the more effective the site is at generating revenue.  The RPV is calculated by dividing the total revenue by the total number of visitors.
The conversion rate is often the easiest and best success metric to use within your TMT cycles.  But, depending on what you are trying to achieve, other success metrics are sometimes more appropriate.  It is important that you choose the right success metric for the job.

Understanding noise & latency

When planning your TMT cycles it is important to understand the concepts of ‘noise’ and ‘latency’ and the impact that they can have on your TMT cycles.   If you do not understand noise and latency you can end up coming to the wrong conclusions and making the wrong decisions because you have misinterpreted your results.

What is Noise?

Noise means any outside factors that can have an impact or skew the results of your test.  If you are not careful noise can cause the results of your test to be incorrect, which in turn will result in you making incorrect decisions. 
  • Examples of noise which might impact the results of your test are below.
  • Natural disasters (Volcano erupting, big storm etc)
  • Commercial noise (Interest rate rise, stock market crash etc)
  • Promotional noise (major changes in the promotion of your website)
  • Publicity / Media noise (articles in magazines or newspapers about your industry or organisation)
  • Competitive noise (competitor does something drastic or unusual in their webmarketing)
  • Seasonal noise (Christmas, Easter, Mothers Day etc)
  • Day of Week Noise (different results on different days)
You need to be asking yourself – what outside ‘noise’ could be impacting the results of this test.  Do I need to run the test for longer period of time?  Should I keep the length of test short?  Should I exclude results from a certain period of time from the overall test?

What is Latency?

On many occasions visitors will not immediately respond to your offers.  Sometimes they will take days, weeks or even months to respond to your offers.  This is called latency.  Even the most compelling, low-risk offers have a degree of latency.   High ticket offers and complex offers will often have very high latency.

If you are not aware of the latency associated with your test you can end up with the wrong result and in turn make a wrong decision.  Once you have stopped your test you will need to continue measuring your results for a period of time. 

Understanding the control

With any TMT cycle you need to have a ‘control’, ie what is  current best version,  and it is that you want to measure against.  Your control sets the standard.

Before you set up a test you want to know exactly what results your control produces.   You also should know the ‘latency’ associated with your control.

Planning your recipes

Once you know your success metric (‘signal’) and your control, you are ready to set up your recipes.  These are the variations to the control that you want to test.  You need to carefully plan your recipes before you start your TMT cycle.

There are an almost unlimited number of things that you can TMT but I would recommend that initially you focus on these elements in your recipes:
  1. Headlines
  2. Opening Hooks
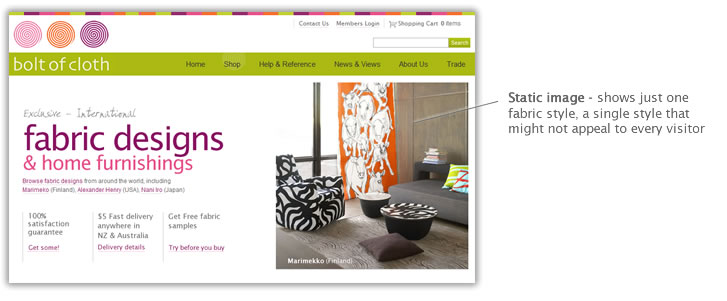
  3. Pictures / Hero Shots
  4. Trust Building Elements
  5. Pre-Sales Copy
  6. Teasers and Short Copy
  7. Bulleted Lists of Benefits or Features
  8. Calls To Action
  9. Pricing / Your Offers
  10. Order Forms / Check-Outs
  11. Length of Forms
  12. Button & Link Messaging
  13. Cross Sells & Up Sells
  14. The P.S
In addition to testing the different elements outlined above it is often a good idea to test ‘element attributes’.  What I mean by this is: the element might be the headline.  But some element attributes might be font size, font colour and so on.  Examples of common element attributes are as follows.
  • Size
  • Alignment
  • Style
  • Colour
  • Background Colour
  • Position
  • Bold / Italics / Underline
The options are almost endless.  Use your intuition here and create recipes that you think are likely to lead to a positive result.  Focus on the elements that that appear on the screen without needing to scroll first.

How to test

There are a number of different ways that you can conduct a TMT cycle.  Before we look at this though - a very common and valid question is: how long do I need to run my test before I can trust the results?  Or how many visitors do I need to have to each different recipe before I can trust the result of the test?
This is very difficult question to answer as it depends on the noise and the difference in the results between the control and the recipe.   Good testing software will tell you the ‘Confidence Level’ that your test has achieved (i.e. 60%, 90%, 95%, 99% etc).  However if you don’t have sophisticated testing software, as a general rule of thumb, I like to run my tests on a minimum of 500-1000 high quality visitors (quality prospects – not random clickers etc) before trusting the results.

Let’s take a look at the different ways to conduct a TMT cycle.
  1. Basic Testing
    Run the control – run the recipe.  This sort of testing is very susceptible to the effects of noise.  Be very careful and think through any outside noise that may impact the results of the test.  And make sure you run large sample sizes to keep the confidence level of your tests nice and high.
     
  2. Split Testing
    Split testing allows you to run the control and the recipe(s) at the same time with the traffic split between the two.  This helps you minimise the impact of any noise.   Split testing requires specialised software, but as long as you have it the software is simple to use.  If you are new to testing, split testing is a good place to start because it is easier to get solid scientific data, gain some testing experience and avoid many of the common pitfalls. 
     
  3. Multivariate Testing
    Multivariate testing allows you to test many different variables at the same time using sophisticated statistical analysis.  Multivariate testing allows you to optimise a page as quick as possible but it requires powerful software, careful planning and it is complex to set up a successful TMT cycle.
Topics: Measure, Persuasion
 

Website measurement is vital

Written by David Kelly on November 12th, 2009.      0 comments

You have probably heard the quote – ‘if you can’t measure it – you can’t manage it’. Before you can improve something you need to carefully measure it - only once you know how something is currently performing can you can try new initiatives to see if you can improve it. 

Let me tell you a little story to illustrate my point:

A good friend of mine, John, tells an interesting story from when he worked as a business consultant in Melbourne, Australia.  During this time, he worked with a client who owned a car audio business. 

One of the first things John investigated on his first day on the job was the marketing expenditure of the company.  On talking with the owner of the business he discovered that the business was spending many thousands of dollars (the majority of its marketing budget) on radio advertising.  He asked the business owner how many sales resulted from the radio advertising on a weekly basis and was promptly informed that the business owner had absolutely no idea.

John then implemented a rudimentary measurement system whereby every customer who came to the counter to purchase some product was asked the question, “How did you hear about us?”  The answers to this question were recorded on a simple chart located beside the till.  After two weeks of careful measurement both John and the business owner were shocked to find that only two sales had occurred as a result of the radio advertising!

John's first recommendation to the business owner was that they scrap the radio advertising immediately.  On further analysis of the results, they also discovered that the majority of the sales over the two week period had resulted due to the location of the store.  People noticed the store on a daily basis because it was located next to a busy street that people used to drive to work and back again.  John’s next recommendation was that they develop some better store signage and put some further effort into their window displays.

The resulting changes made a huge impact on the business and they all occurred as the result of some simple measurement!

So … how can we apply the moral of this story to our websites?  If we want to improve our website results we must carefully measure the different aspects of our website's performance to discover what is working, and what is not working.  Makes sense, right?

The great news is this.   Measurement with a website is amazingly simpler than measurement in the real world!  The invention of the computer has made possible levels of measurement that were only dreamed about by previous generations.  On a website, provided you have the right systems (for example – a system created by Zeald!), absolutely everything can be automatically tracked and measured by the computer!

Make sure your website has powerful tracking and measurement systems in place.  You should be able to access critical information about the results of your website at the click of a button.  If you want to achieve amazing website results, great measurement is absolutely vital!
Topics: Measure
 

Tall Poppy - Homepage Split Test

Written by Hamish Braddick on April 1st, 2008.      0 comments

Overview

When we redesigned the Zeald website, we wanted to test a radical redesign. We wanted to convey our company's USP, which is 'Smart Results Online' - helping you achieve amazing results online.

We realised that many other webdesign companies boast this same USP these days, so we wanted to prove that we are ahead of our competitors in this regard, and for a number of reasons. We wanted to let people know that we were the best at it, and we believed that we, unlike our competitors had the proof to back it up. But it is a bold claim and we realised that in New Zealand this could be a problem with the Tall Poppy Syndrome - so what better way to find out than to TMT it.

Hypothesis

Since it was not possible to test an entire page with Google Optimiser and also test multiple conversion goals, Google Optimiser was not going to work for us. So we had our R&D team build a new Add-on module for our websites, which our TMT consultants can use to very quickly and easily to setup and measure accurately, split tests such as this.

This is very important because it allows us to test our primary conversion goal to see if we improve the conversion rate, however it is just as important that we also know how our other conversion goals are impacted. For example we might find that we increase our primary conversion goal by X% but jeopardise our others and cost the company significant business.

Google Optimiser doesn't allow this kind of reporting on multiple conversion goals.

The Experiment

Because we rely on our Zeald website for a large percentage of our business leads, it was risky for us to launch a radical redesign and risk losing a large percentage of sales each month. So we restricted the views of the new design to just 10%.

The Original (the Control)

Homepage Split Testing
 

Test 1

In this homepage, we wanted to push our portfolio as we believed that many of our potential customers are more concerned about the design and are not aware of all the other elements that make a successful website.

Homepage Split Testing

Results

Tests Conversion Goal 1 (% change compared to original) Conversion Goal 2
Hompage Split Testing Original screen Original screen
Tall poppy homepage split test 30.7% decrease compared to original 10.6% decrease compared to original

These are the results we had from our first test of the split screen, which was tested without any back up pages. We will be running a second test with a back up article to see how it impacts the results.

Check back soon for our test 2 results...
 

Measuring & Improving your Website Results

Written by Hamish Braddick on April 1st, 2008.      0 comments

This article is all about testing and improving your website results. Within your normal business you will always be looking for ways to make everything work better. You need to do the same with your website. The tune process can be summed up with three words – ‘Test’, 'Measure' and 'Tune'.

One of the reasons the Internet is a direct marketer’s dream, is just about everything can be measured automatically! If you’ve been in business for any length of time you will know how hard it can be to measure your results (and it takes a heap of time and effort). Website marketing is quite different– you barely have to lift a finger, it just happens!

Most people just don’t get how incredibly powerful this is!

If you understand what needs to be measured, then you can measure it, read the measurements and make adjustments to your website to improve your overall result. This is unbelievably powerful!

So, what do you need to measure?

Well that is a subject in our book– “Website Fundamentals – How to Generate Amazing Results Online! ”. But to save you sourcing the relevant section right now, the crucial parts follow…

Success Metrics

Within any business there are a number of simple success metrics that determine the performance of the business.

In the physical world, success metrics are– leads, conversion rate, average sale and margin. Let’s take a closer look at each of these:

  • Leads
    A lead is a potential customer that has enquired about your product or service. The leads success metric represents the number of people that have enquired about your products or services over a particular period of time.
  • Conversion Rate
    The conversion rate is the percentage of people that purchased products or services from you. A 20% conversion rate means that for every 10 leads you made two sales.
  • Average Sale
    The average sale represents how much people usually spend with you. Each time customers buy from you, do they spend, on average $20, $200, or $2000?
  • Margin
    The margin is the percentage of every sale that is profit– after all the costs are taken out. A 20% margin on a $1,000 sale means your profit was $200.

The most important thing to understand about success metrics is this –

If you can increase ANY ONE of the success metrics then your business will make more money!

It’s that simple.

If you want to run a successful business you need to know and understand success metrics and therefore how they influence your business. The same applies if you want to run a successful website– you need to understand success metrics on the Web and how they affect your website.

The key success metrics for a website that sells products, with transactions automatically completed online (an ecommerce website), are ‘visitors’, ‘conversion rate’ and ‘average sale’.

‘Visitors’ is a new success metric, which is a more accurate description of receiving a prospect on an e-commerce website. The ‘visitors’ success metric refers to the amount of ‘traffic’, or visitors, your website receives.

As with most businesses, the ‘margin’ is still determined by the physical aspects of the business (and includes the cost of running the website, so it is an expense that affects your margin).

The key success metrics for a website that is focused on generating enquiries (an Profile website) are ‘visitors’ and ‘conversion rate’.

An Profile website is designed to generate leads. Everything after the generation of the lead on the Profile website is still processed in the physical world.

An example of a company using an Profile website would be a service-oriented business, or a business with large custom-made products that are less suitable for making purchases and payments via an Ecommerce website.

So on the Internet, success metrics can be summarised as follows:


Website Success Metrics Summary
ecommerce Website Profile Website
Visitors Visitors
Conversion Rate Conversion Rate
Average Sale  

Learn How to Improve your Website Conversion Rate

Learn How to Increase your Number of Website Visitors

Learn How to Increase your Average Sale Amount

Topics: Measure
 

About Zeald

Zeald was formed in 2001 by three young guys from the small New Zealand town of Mangawhai Heads. Now, Zeald is the largest website design and digital marketing agency in New Zealand and has recently made moves into Australia. This is the Zeald story …

read more
 

Connect With Us

Keep up to date with industry news, stay ahead of the competition with our helpful articles

Google Plus Facebook Youtube Twitter Linkedin


Contact Us

New Zealand
09 415 7575
Australia
1800 224 032

42 Tawa Dr, Albany, Auckland 0632

Support